The Refugee Bureau
DATA
Charts and data explainers
Interactive charts on U.S. refugee admissions, built from the State Department's published figures.
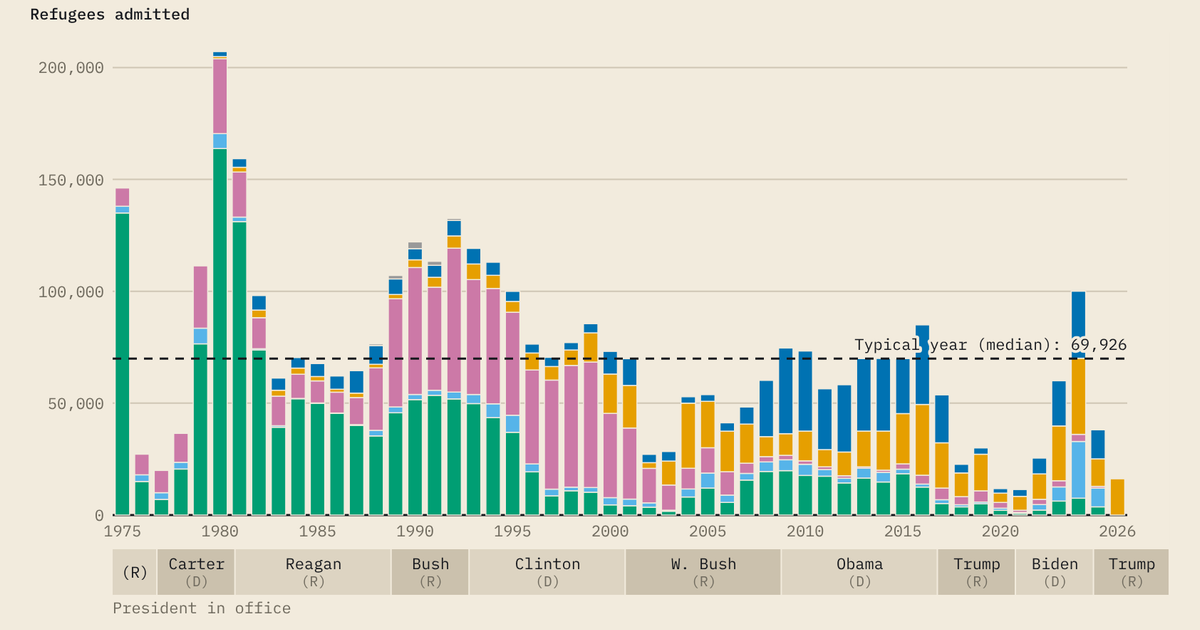
Refugee Admissions, 1975–2026
Interactive · by region and country of origin, with presidentsFrom 85 Countries to 2
Video · Data Explainer No. 1In FY2026, the United States admitted refugees of two nationalities: 16,287 from South Africa and 5 from Afghanistan. From FY2001 to FY2025, refugees of 50 to 85 nationalities arrived every year.
Nine Presidents, 3.7 Million Refugees
Video · Data Explainer No. 2Since FY1975, nine presidents have resettled more than 3.7 million refugees in the United States, about 71,000 a year. Through September 2026, the second Trump administration has admitted 16,798, roughly 10,000 annually and the slowest pace on record.